
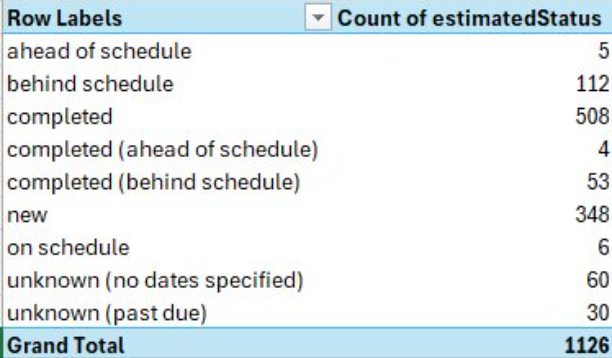
Taken from Canada’s own data. The analysis of Canada’s existing projects reveals significant inefficiencies and mismanagement. Out of a total of 1,126 projects, a considerable proportion exhibit troubling statuses:
- Behind Schedule: With 112 projects lagging behind schedule, this suggests a systemic issue in project management, resource allocation, or possibly unrealistic initial scheduling. This delay increases costs and undermines the credibility and effectiveness of project planning.
- Completed (Behind Schedule): The fact that 53 projects are completed but behind schedule further emphasizes the inability to adhere to timelines. This lag disrupts subsequent project phases and reflects poorly on the planning and execution processes.
- Unknown (No Dates Specified): The presence of 60 projects with unspecified dates is a glaring red flag. This lack of critical scheduling information indicates a fundamental lapse in project documentation and transparency. Such ambiguity hampers the ability to track progress and hold stakeholders accountable.
- Unknown (Past Due): Another 30 projects are past due with unknown statuses. This uncertainty highlights severe lapses in communication and project oversight. The inability to ascertain the current state of these projects undermines any attempt at effective project control and completion.
- Minimal Projects Ahead of Schedule: Only 5 projects are ahead of schedule, which is an alarmingly low number. This indicates a severe inefficiency in project management practices where the majority of projects fail to exceed expectations.
- New Projects: While 348 new projects indicate ongoing efforts and ambitions, the already visible mismanagement issues cast doubt on the potential success of these upcoming initiatives. Without addressing the systemic issues, these new projects are likely to suffer the same fate.
- Completed (Ahead of Schedule): With only 4 projects completed ahead of schedule, this represents a minuscule fraction of the total projects, highlighting a lack of proactive project acceleration and efficiency.
- On Schedule: A mere 6 projects are on schedule, which is a pitifully small percentage. This further illustrates widespread project mismanagement and the inability to maintain planned timelines.
The analysis reveals a dismal performance in managing Canada’s existing projects. The overwhelming number of projects behind schedule, coupled with the significant number of unknown statuses, points to deep-rooted issues in project planning, execution, and monitoring. Urgent reforms and strategic interventions are necessary to address these systemic flaws and ensure more reliable and transparent project management practices going forward.
In addition to this there are 348 projects listed as new, accounting for over 4.2 billion dollars. however, the estimated completion date has already passed which asks the question, what is the true status of these.
With their reporting on their website, I do not see anything related to reporting on “Status” which is one of the most critical components when we think about key performance indicators, or KPIs.

With the volume of lagging projects, and the reality that in most cases, lagging projects result in increased costs, it’s no wonder our government is overspending at every turn. A complete overhaul of the procurement and project management activities is very much needed that I would conservatively estimate billions in savings over the course of a few years.
Currently, with almost 7 billion dollars in projects behind schedule, this could result in an overrun as high as another 3 billion dollars. Canada can no longer afford this complacency whereby something needs to be done.
Glaring Absence in KPIs: Start Date of the Project
One glaring omission in the current Key Performance Indicators (KPIs) is the absence of a Start Date for the projects. Without a clearly defined start date, it becomes nearly impossible to track the project’s progress accurately or anticipate its actual end date. The start date is a fundamental metric that anchors the entire project timeline, allowing project managers to measure performance against planned milestones and deadlines effectively.
The absence of a start date hampers the ability to identify delays early and implement corrective measures promptly. It also obscures the project’s lifecycle, making it difficult to conduct a thorough post-project analysis to learn and apply lessons to future projects. This oversight contributes to the broader issues of mismanagement and inefficiency, as it removes a crucial element of accountability and transparency in project reporting.
Integrating start dates into the KPI framework would enhance the precision of project tracking and forecasting, thereby improving the overall effectiveness of project management. This change is essential to mitigate the risk of further delays and cost overruns and to ensure more reliable delivery of future projects.
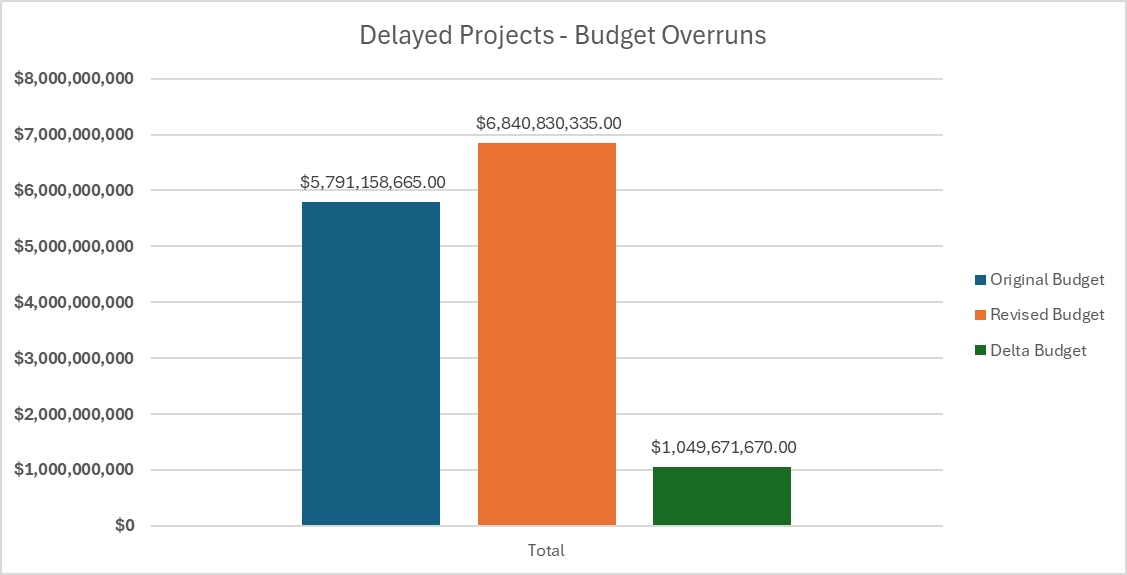
The diagram titled “Delayed Projects – Budget Overruns” visually represents the financial implications of project delays within a specific dataset. The bar chart breaks down the budgetary figures into three key categories: Original Budget, Revised Budget, and Delta Budget.
- Original Budget:
- Represented by the blue bar, the Original Budget for the delayed projects totals $5,791,158,665.00. This figure indicates the initial cost estimation allocated for these projects before any delays or adjustments.
- Revised Budget:
- Depicted by the orange bar, the Revised Budget amounts to $6,840,830,335.00. This revised figure reflects the updated cost estimation after accounting for delays, changes in scope, or other project-related factors that necessitated an increase in the budget.
- Delta Budget:
- Illustrated by the green bar, the Delta Budget stands at $1,049,671,670.00. This value represents the difference between the Revised Budget and the Original Budget, highlighting the additional costs incurred due to project delays.
The significant increase from the Original Budget to the Revised Budget underscores the financial impact of project delays, amounting to an overrun of over one billion dollars. This cost overrun signifies inefficiencies in project management and emphasizes the need for better planning, resource allocation, and adherence to schedules to mitigate such financial burdens in future projects.
In summary, the diagram effectively communicates the substantial budgetary implications of project delays, showcasing the necessity for improved project oversight and management practices to prevent similar cost overruns in the future.

Leave a comment